
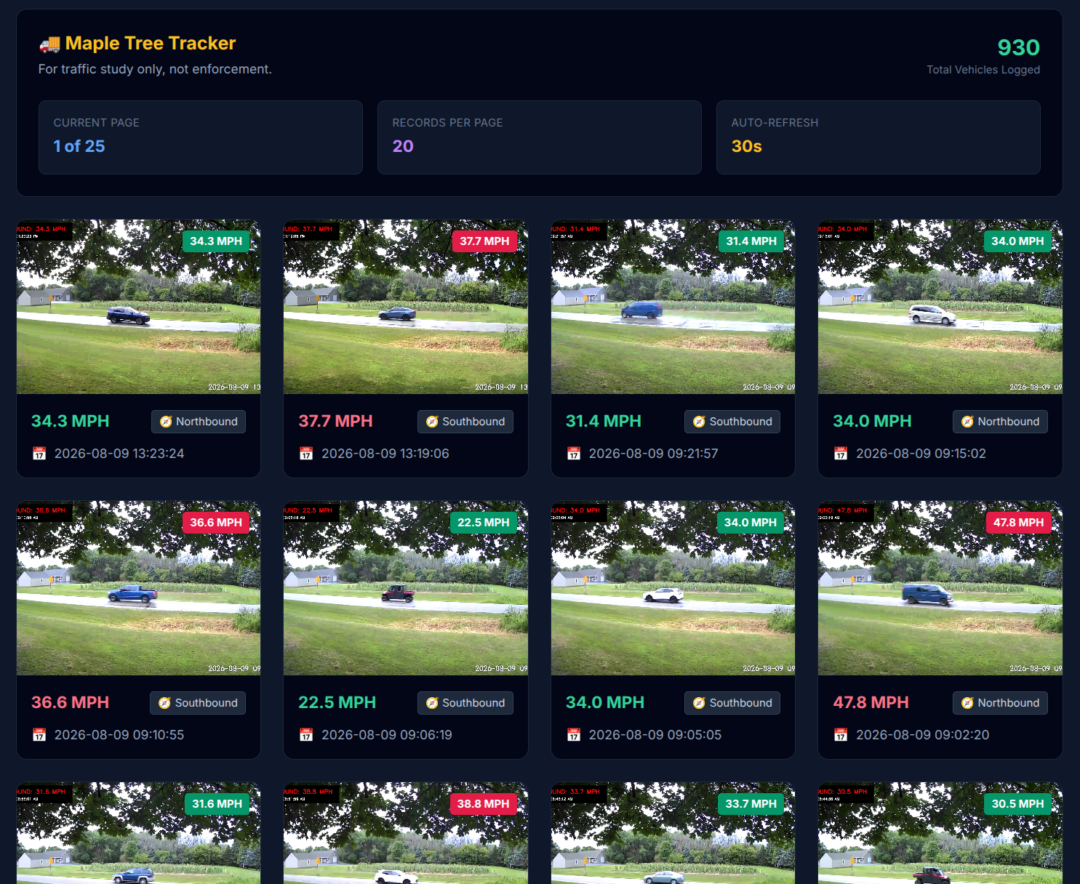
Tracking Manure via Open-Source Telemetry
COTS Speed Tracker Introduction:
To the casual observer, rural township roads across the upper Midwest are quiet, idyllic, and predictable stretches of asphalt. But during seasonal agricultural windows, these local paths can transform overnight into high-volume industrial shipping corridors.
As large-scale concentrated livestock facilities race against unpredictable weather models to manage millions of gallons of liquid byproduct before major rainfall events, a massive logistics wheel begins to turn. Upwards of 30 to 40 fully loaded, 100,000-pound liquid commercial tankers loop continuously past residential homes, cycling back and forth between distribution hubs and regional storage sites.
This creates an invisible public safety and structural engineering crisis. These heavy trucks subject thin local asphalt to brutal, repetitive axle-weight forces. In many areas, un-posted township bridges—structures engineered only for standard passenger traffic and occasional light implements—are forced to absorb severe mechanical pounding.
Historically, tracking these localized infrastructure fatigue cycles has been nearly impossible. Small municipal governments rarely have the budget or personnel to deploy full-time speed tracker logging equipment, measure vehicle velocities, or chart structural stress intervals over extended periods.
To bridge this data gap, an independent developer deployed an anonymous citizen telemetry project: an open-source, edge-computed radar tracking system built to capture the cold, hard data receipts of rural commercial hauling.
The Maker’s Proof-of-Concept: Proving it with Off-the-Shelf Parts
While the project yields heavy empirical datasets, its underlying motivation remains grounded in pure engineering curiosity. The primary objective was a software deployment experiment: to discover if a high-fidelity speed tracker traffic analytics center could be built using affordable consumer components rather than proprietary industrial radar units. By leaning heavily on an open-source software stack, this “Do-It-Yourself” blueprint proves that standard, accessible electronics can match the processing accuracy of hardware costing thousands of dollars, demonstrating the power of creative systems integration.
System Architecture: From Canopy Edge to Cloud Database
Building a roadside tracking system that can reliably detect, clock, and log industrial freight requires a decoupled hardware and software layout optimized for processing efficiency, speed, and absolute physical anonymity.
[Fixed Optics View] ──(RTSP Network Stream)──> [Edge Client Processing Core]
                                                   │ (Computer Vision Velocity Matrix)
                                                   ▼
[MariaDB Cloud Database] <──(POST Auth Handshake)──> [upload.php Script Handler]
         │                                                   │
         ▼                                                   ▼
[All-In-One Analytics Interface]                   [Local Disk Cache Pruned < 500]
1. Hardware & Local Capture Layer
-
- The Optic Sensor: A standard weatherproof webcam positioned discreetly within an elevated tree canopy provides a clean, unobstructed horizontal view of the active travel lane.
- The Edge Core: A local PC running an open-source Linux environment (Zorin OS 18) pulls the raw webcam feed via a localized Docker bridge container, turning the network stream into a reliable, low-latency processing source.
- The Velocity Engine: A custom Python 3 background script evaluates the video stream frame-by-frame. When a moving object enters a predefined tracking boundary, the software measures pixel velocity delta across a precisely calibrated physical distance array (set to 60 feet for absolute real-world accuracy).
2. The Cloud Ingestion Pipeline
Once a vehicle is clocked, the local edge computer packages the metrics and fires an immediate multipart form-data HTTP POST request across the web to a remote web server.
-
- Secure Handshake: The backend gateway script (
upload.php) validates the payload using a custom token handshake framework to prevent unauthorized database manipulation or external tampering. - Dynamic Data Split: The script parses the incoming tracking parameters (
timestamp,speed,direction) and securely injects them into an indexed MariaDB/MySQL database table.
- Secure Handshake: The backend gateway script (
sql
CREATE TABLE traffic_telemetry (
    id INT AUTO_INCREMENT PRIMARY KEY,
    timestamp INT NOT NULL,
    speed DECIMAL(4,1) NOT NULL,
    direction VARCHAR(20) NOT NULL,
    image_path VARCHAR(255) NOT NULL,
    INDEX idx_timestamp (timestamp)
);
The Hybrid Storage Solution: Combating Server Space Bloat
Industrial agricultural shipping moves fast. With dozens of multi-axle tankers running loops all day long, high-resolution evidence photos accumulate rapidly. At roughly 1 MB per image, a heavy hauling sequence can easily generate gigabytes of data that would quickly choke standard web hosting file systems.
To solve this, the project implements a hybrid retention storage matrix:
-
- Permanent Data Archive: The raw numeric telemetry metadata (time, direction, speed) is streamed straight into indexed database rows. Because text data requires minimal space, millions of records can be archived permanently without lagging the server or filling up disk arrays.
- Rolling 500-Item Media Cache: The server’s physical image folder and flat-file index cache are capped via active server-side logic. On every single incoming upload, the script counts the total imagery on disk. If the cache exceeds 500 images, PHP triggers an immediate cleanup sequence on the oldest files, maintaining a constant rolling timeline of visual evidence while keeping historical records safely preserved in the database.
Speed Tracker Center: Instant Visualizations
To avoid the common trap of slow-loading web modules, the system’s analytics engine groups all data collection via a single query that shifts 100% of the mathematical range sorting and data aggregation directly into the native database engine.
The frontend dashboard combines native CSS grids with an optimized Chart.js engine to display clean analytics metrics in fractions of a second:
-
- Hourly Commute Density Spikes: A bar-line graph mapping traffic surges across a 24-hour cycle. It clearly flags when heavy commercial volume deviates from normal residential commutes.
- Lane Activity Bias: An instant doughnut chart displaying directional lane usage splits.
- Velocity Volume Spectrum: A strict histogram tracking speed distribution across standardized bins, grouping compliance versus high-velocity traffic behaviors.
- Congestion / Velocity Correlation: A scatter plot diagram mapping average travel speeds against hourly traffic density to provide mathematical proof of vehicle behavior under heavy congestion.
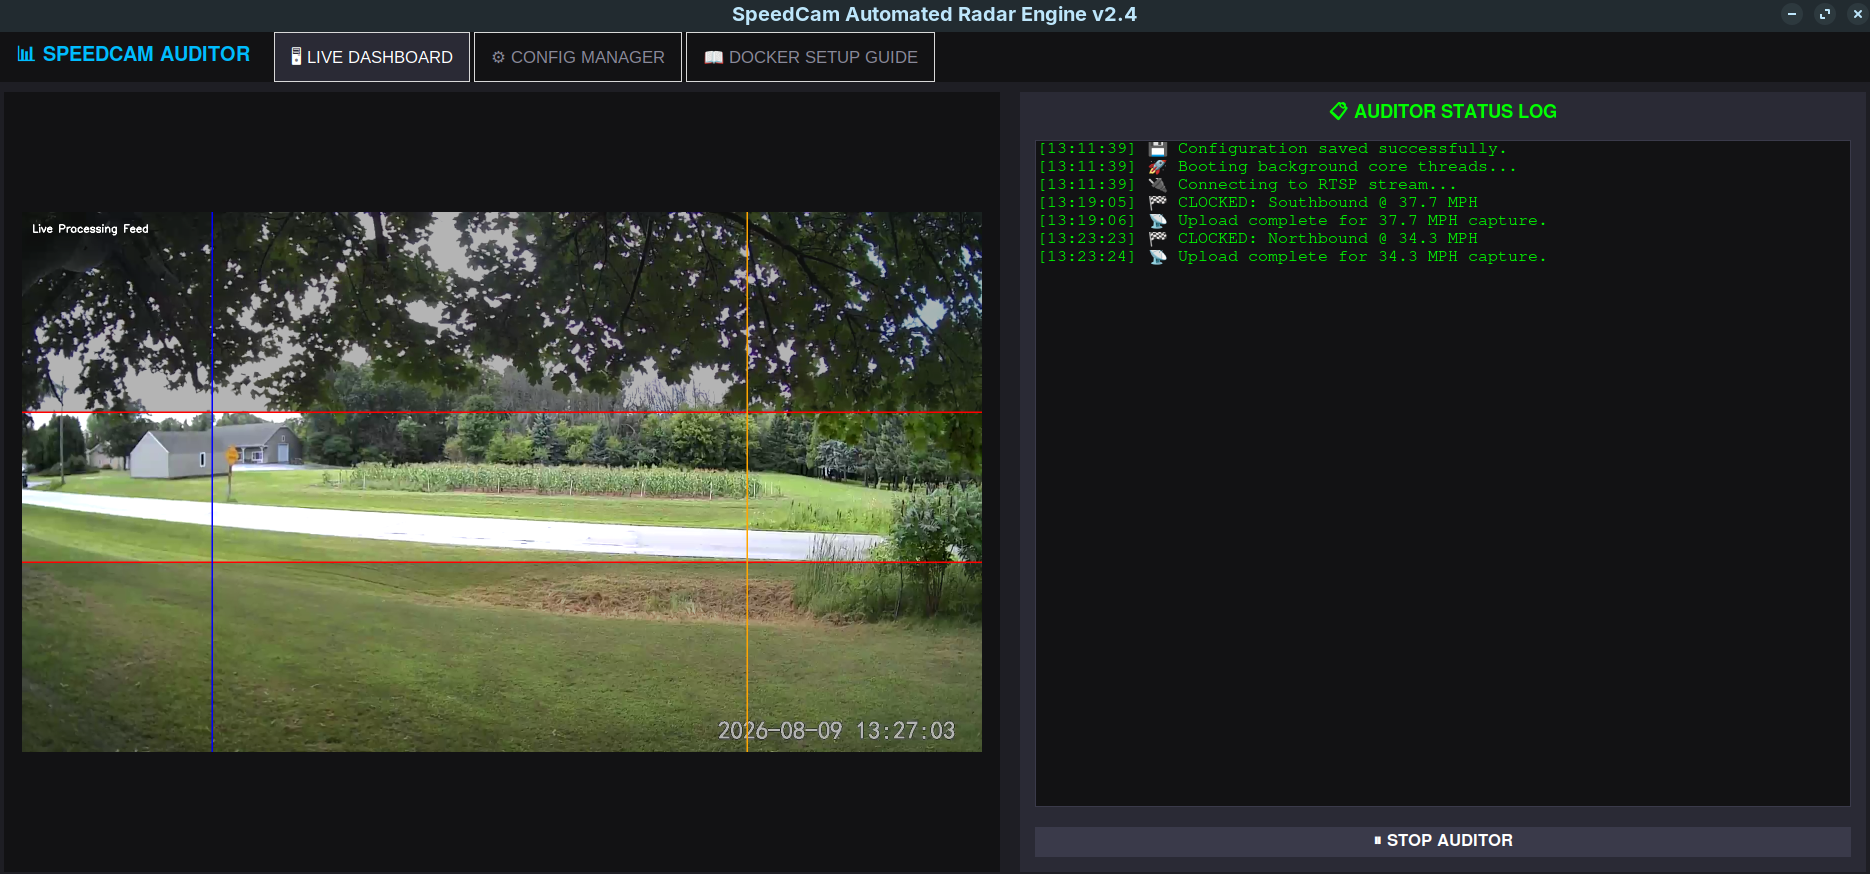
Python3 Speed Tracker running on LINUX PC.
Real-World Telemetry: What the Sensor Revealed
Once deployed and calibrated, the speed tracker system immediately began validating localized infrastructure concerns with striking real-world data points:
The Industrial Tanker Profile
The camera regularly logs industrial semi-tankers moving smoothly along the route at exactly 25.0 MPH. While this matches local speed constraints, it documents a continuous, heavy pounding of local infrastructure under maximum freight loads.
The Slowest Records
The system effectively tracks everything from high-speed passenger cars down to local farm implements. It recently clocked a local tractor hauling an open agricultural spreader at an authentic 17.3 MPH—proving the system’s tracking accuracy across vastly different profiles.
The Reckless Night Outliers
The database exposed severe safety risks that would have vanished unnoticed under old tracking methods. Early morning logs revealed a vehicle flying past the radar block at 3:00 AM at 80.5 MPH, followed by another clocked at 4:00 AM running at 70.9 MPH.
Conclusion: Data Over Badges
When monitoring local community infrastructure, skeptics often dismiss citizen concerns as mere grumbling. Because citizen radar rigs lack an official badge or municipal uniform, critics sometimes argue that private traffic monitoring serves no purpose.
But data requires no official badge to be accurate; it simply relies on the unyielding laws of physics.
When a township board, highway commissioner, or county supervisor sits down to review maintenance budgets or evaluate structural fatigue on a vulnerable bridge deck, they do not act on anecdotes. They act on cold, unarguable metrics. By shifting the workload to a secure MariaDB core, smart edge processing, and automated rolling storage limits, this project provides a clean, highly reliable blueprint for completely anonymous, community-driven infrastructure monitoring.